We’ve all head the phrase “correlation does not imply causation” but what does that mean, exactly?
It all comes down to correlation and regression, which are statistical analysis measurements used to find connections between two variables, measure the connections, and make predictions. Measuring correlation and regression is commonly used in a variety of industries, and it can also be seen in our daily lives.
For instance, have you ever seen someone driving an expensive car and automatically thought that the driver must be financially successful? Or how about thinking that the further you run on your morning workout, the more weight you’ll lose?
Both of these are examples of real-life correlation and regression, as you’re seeing one variable (a fancy car or a long workout) and then seeing if there is any direct relation to another variable (being wealthy or losing weight). As we investigate the relationships between two variables, it’s important to know the differences and the similarities between correlation and regression.
Correlation vs. regression
It’s not uncommon for correlation and regression to be confused for one another as correlation can often drive into regression. However, there is a key difference.
What is the difference between correlation and regression?
The difference between these two statistical measurements is that correlation measures the degree of a relationship between two variables (x and y), whereas regression is how one variable affects another.
Basically, you need to know when to use correlation vs regression. Use correlation for a quick and simple summary of the direction and strength of the relationship between two or more numeric variables. Use regression when you’re looking to predict, optimize, or explain a number response between the variables (how x influences y).
| Correlation | Regression | |
| When to use | When summarizing direct relationship between two variables | To predict or explain numeric response |
| Able to quantify direction of relationship? | Yes | Yes |
| Able to quantify strength of relationship? | Yes | Yes |
| Able to show cause and effect? | No | Yes |
| Able to predict and optimize? | No | Yes |
| X and Y are interchangeable? | Yes | No |
| Uses a mathematical equation? | No | y = a + b (x) |
Regardless of what you’re using correlation and regression to see, utilizing a business intelligence platform is the best way to clearly analyze the data you’re looking at in a way that is easy to pinpoint which actionable insights to take. Mining your data with a business intelligence platform allows for simple examination of big data, real-time data, and unstructured data and determine areas for improvement and other notable trends.
Tip: If you’re unsure which BI platform is right for your business, check out over 150 unbiased reviews of business intelligence software from your peers who use this software daily.
If you aren't looking for business intelligence software, but are still hoping to calculate correlation and regression, you're able to find both using various Excel formulas. Just keep in mind that a BI platform is your best bet for increased efficiency and accuracy.
What is correlation?
When it comes to correlation, think of it as the combination of the words “co” meaning together and “relation” meaning a connection between two quantities.
In this sense, correlation is when a change to one variable is then followed by a change in another variable, whether it be direct or indirect. Variables are considered “uncorrelated” when a change in one does not affect the other. In short, it measures the relationship between two variables.
For example, let’s say our two variables are x and y. The changes between these two variables can be considered positive or negative. A positive change would be when two variables move in the same direction, meaning an increase in one variable results in an increase in another variable. So, if an increase in x increases y, it’s positively correlated.
An example of this would be demand and price. This is because an increase in demand causes the corresponding increase in price. The price would increase because there are more consumers who want it are willing to pay more for it.
If two variables are moving in opposite directions, like when an increase in one variable results in a decrease in another, this is known as a negative correlation. An example of a negative correlation would be the price and demand for a product because an increase in price (x) results in a decrease in demand (y).
Knowing how two variables are correlated allows for predicting trends in the future, as you’ll be able to understand the relationship between the variables — or if there's no relationship at all.
Correlation analysis
The main purpose of correlation, through the lens of correlation analysis, is to allow experimenters to know the association or the absence of a relationship between two variables. When these variables are correlated, you’ll be able to measure the strength of their association.
Overall, the objective of correlation analysis is to find the numerical value that shows the relationship between the two variables and how they move together.
One key benefit of correlation is that it is a more concise and clear summary of the relationship between the two variables than you’ll find with regression.
Example of correlation
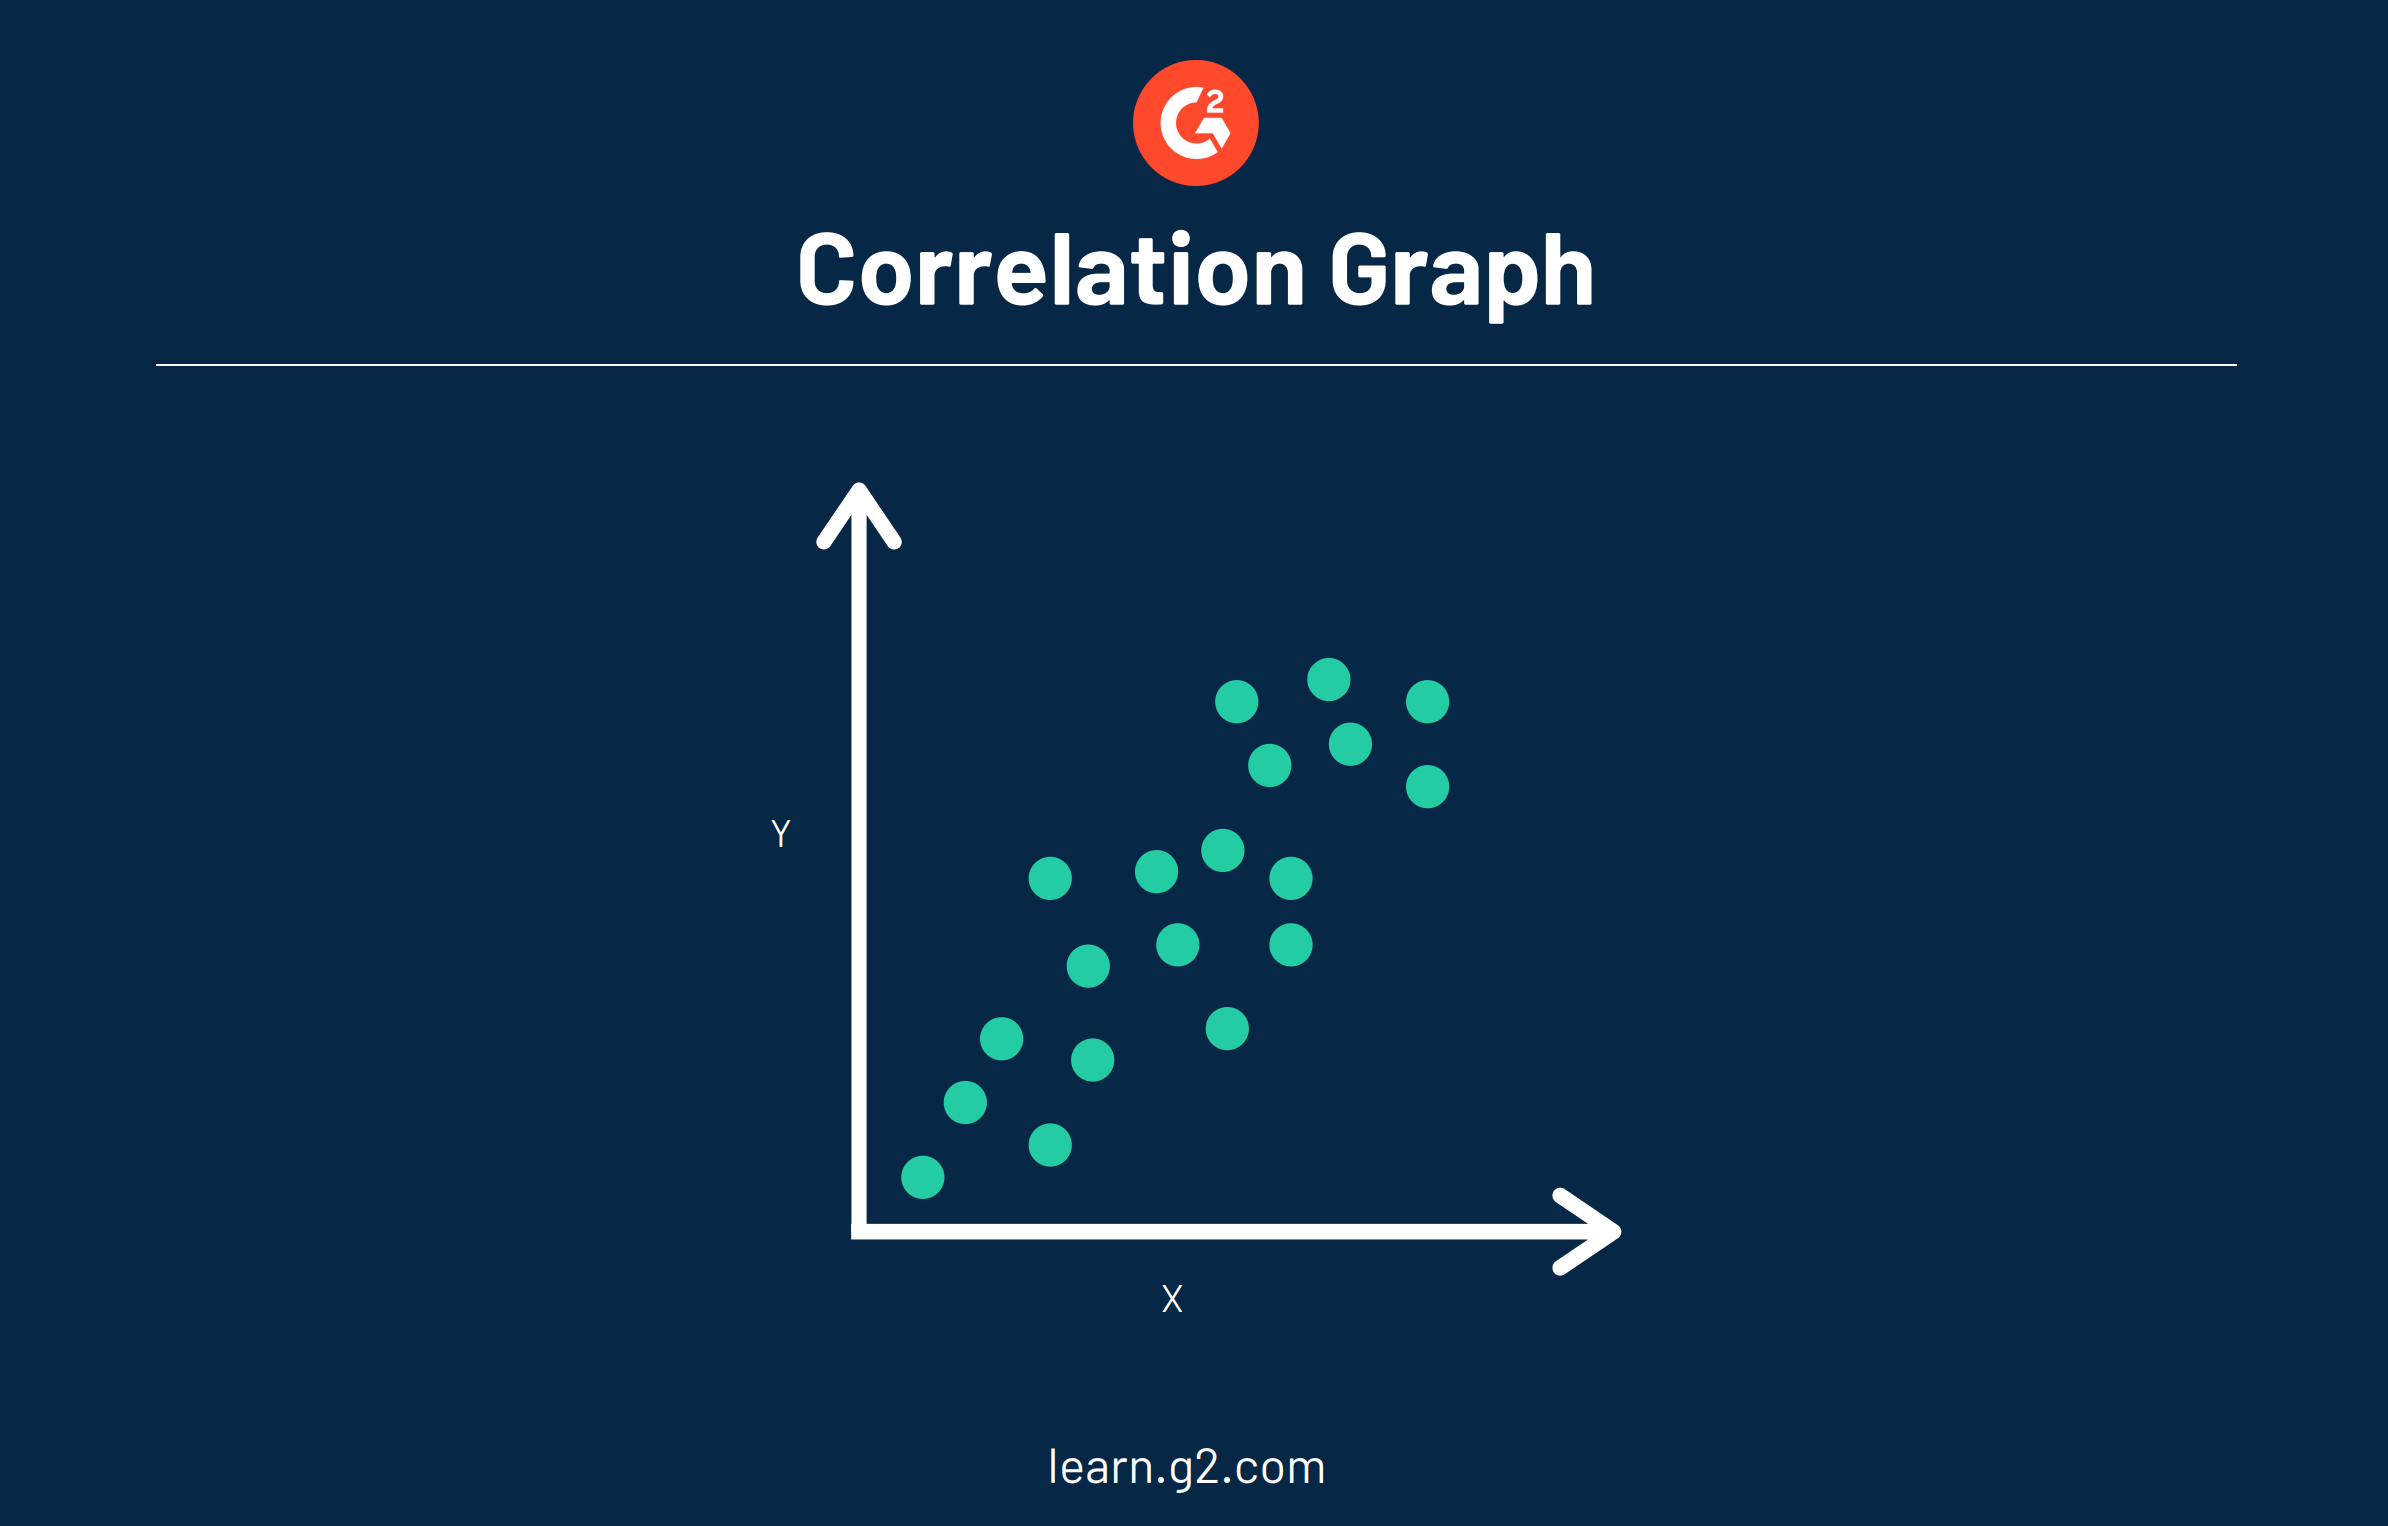
A correlation chart, also known as a scatter diagram, makes it easier to visually see the correlation between two variables. Data in a correlation chart is represented by a single point. In the chart above you can see that correlation plots various points of single data.
Let's think of correlation as real-life scenarios. In addition to the price and demand example above, let's take a look at correlation from a marketing standpoint to see the strength of a relationship between the two variables. For instance, it could be in your company's best interest to see if there is a predictable relationship between the sale of a product and factors like weather, advertising, and consumer income.
Want to learn more about Analytics Platforms? Explore Analytics Platforms products.
What is regression?
On the other hand, regression is how one variable affects another, or changes in a variable that trigger changes in another, essentially cause and effect. It implies that the outcome is dependent on one or more variables.
For instance, while correlation can be defined as the relationship between two variables, regression is how they affect each other. An example of this would be how an increase in rainfall would then cause various crops to grow, just like a drought would cause crops to wither or not grow at all.
Regression analysis
Regression analysis helps to determine the functional relationship between two variables (x and y) so that you’re able to estimate the unknown variable to make future projections on events and goals.
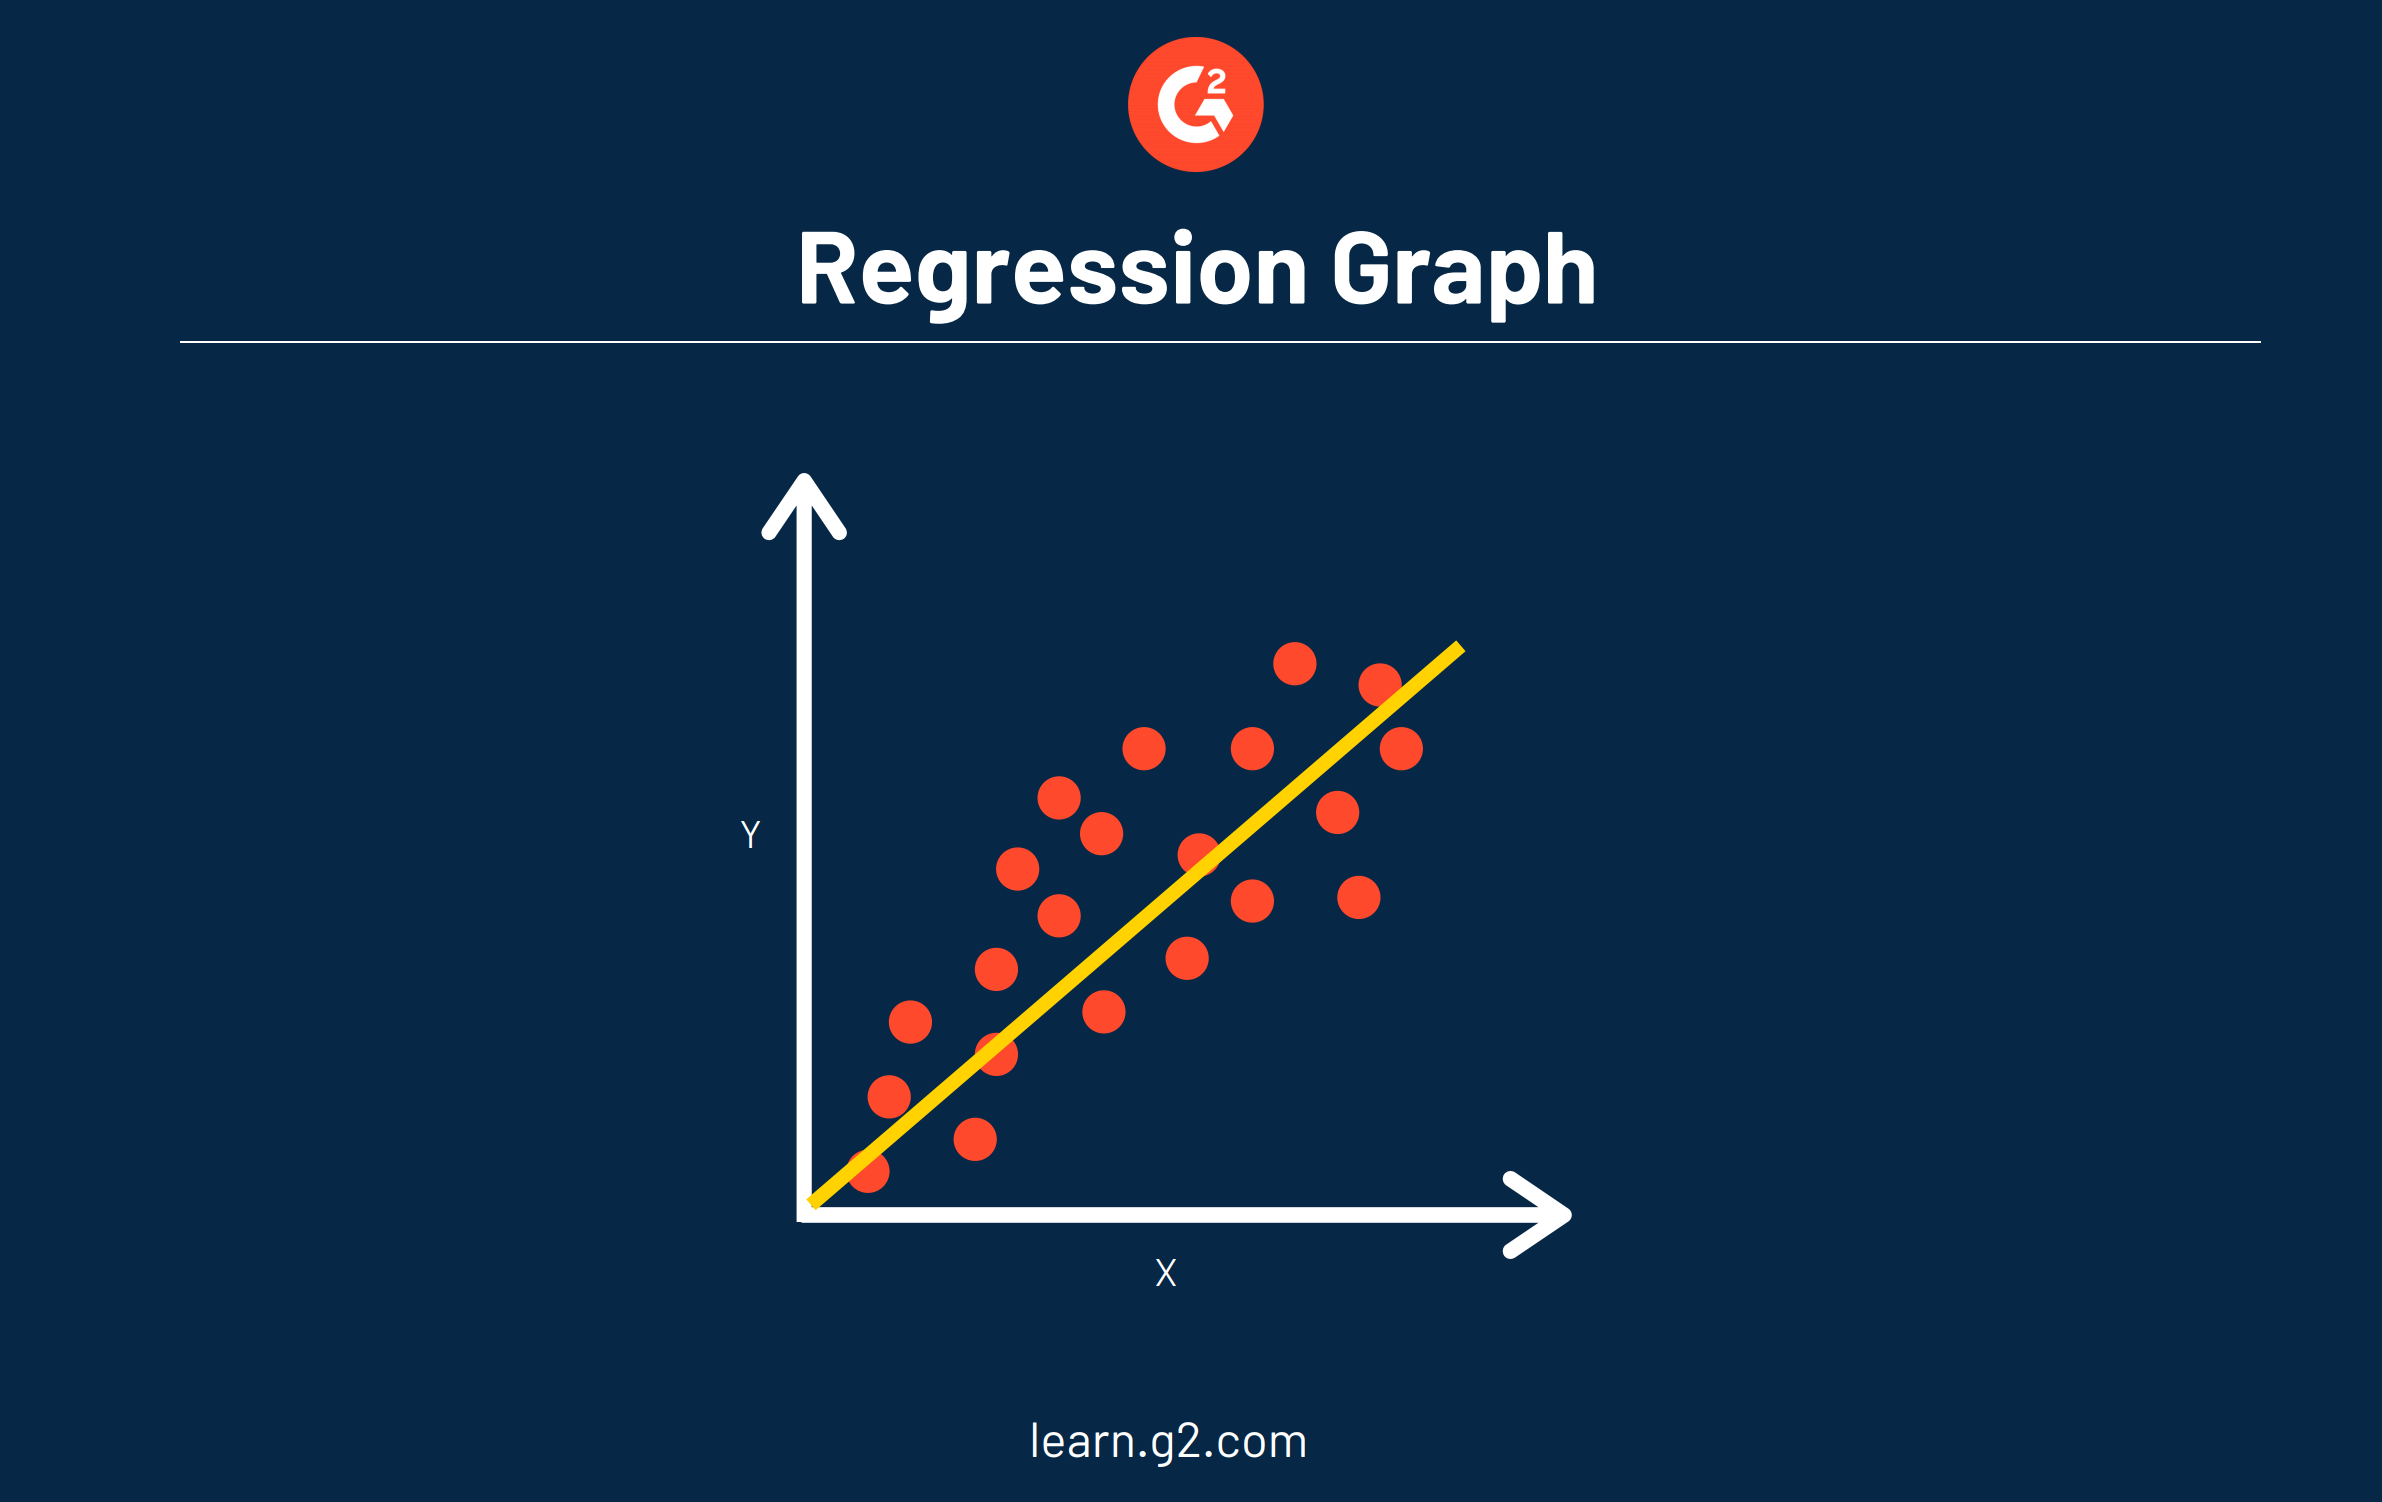
The main objective of regression analysis is to estimate the values of a random variable (z) based on the values of your known (or fixed) variables (x and y). Linear regression analysis is considered to be the best fitting line through the data points.
The main advantage in using regression within your analysis is that it provides you with a detailed look of your data (more detailed than correlation alone) and includes an equation that can be used for predicting and optimizing your data in the future.
When the line is drawn using regression, we can see two pieces of information:
Regression formula
A → refers to the y-intercept, the value of y when x = 0
B → refers to the slope, or rise over run
The prediction formula used to see how data could look in the future is:
Y = a + b(x)
Example of regression
When it comes to using regression, we at G2 utilize regression to predict certain trends, like how our traffic is expected to grow over the coming months.
One person in particular who uses regression is our SEO and Data Analyst, Sarah Harenberg. Being able to visualize our data, analyze it, see trends, and predict what the data could look like in the future is a big part of her job. Many teams at G2 rely on Sarah when they set our team goals and to understand how our traffic could look in the coming months.
Related: Check out how we grew our organic traffic to 1 million monthly visitors in under a year!
She also uses those predictions obtained from regression-based models to set goals for important company metrics, like keyword acquisition. This gives the company insights on how it is currently trending compared to past growth trends since the predictions are based on historical data.
Differences between correlation and regression
There are some key differences between correlation and regression that are important in understanding the two.
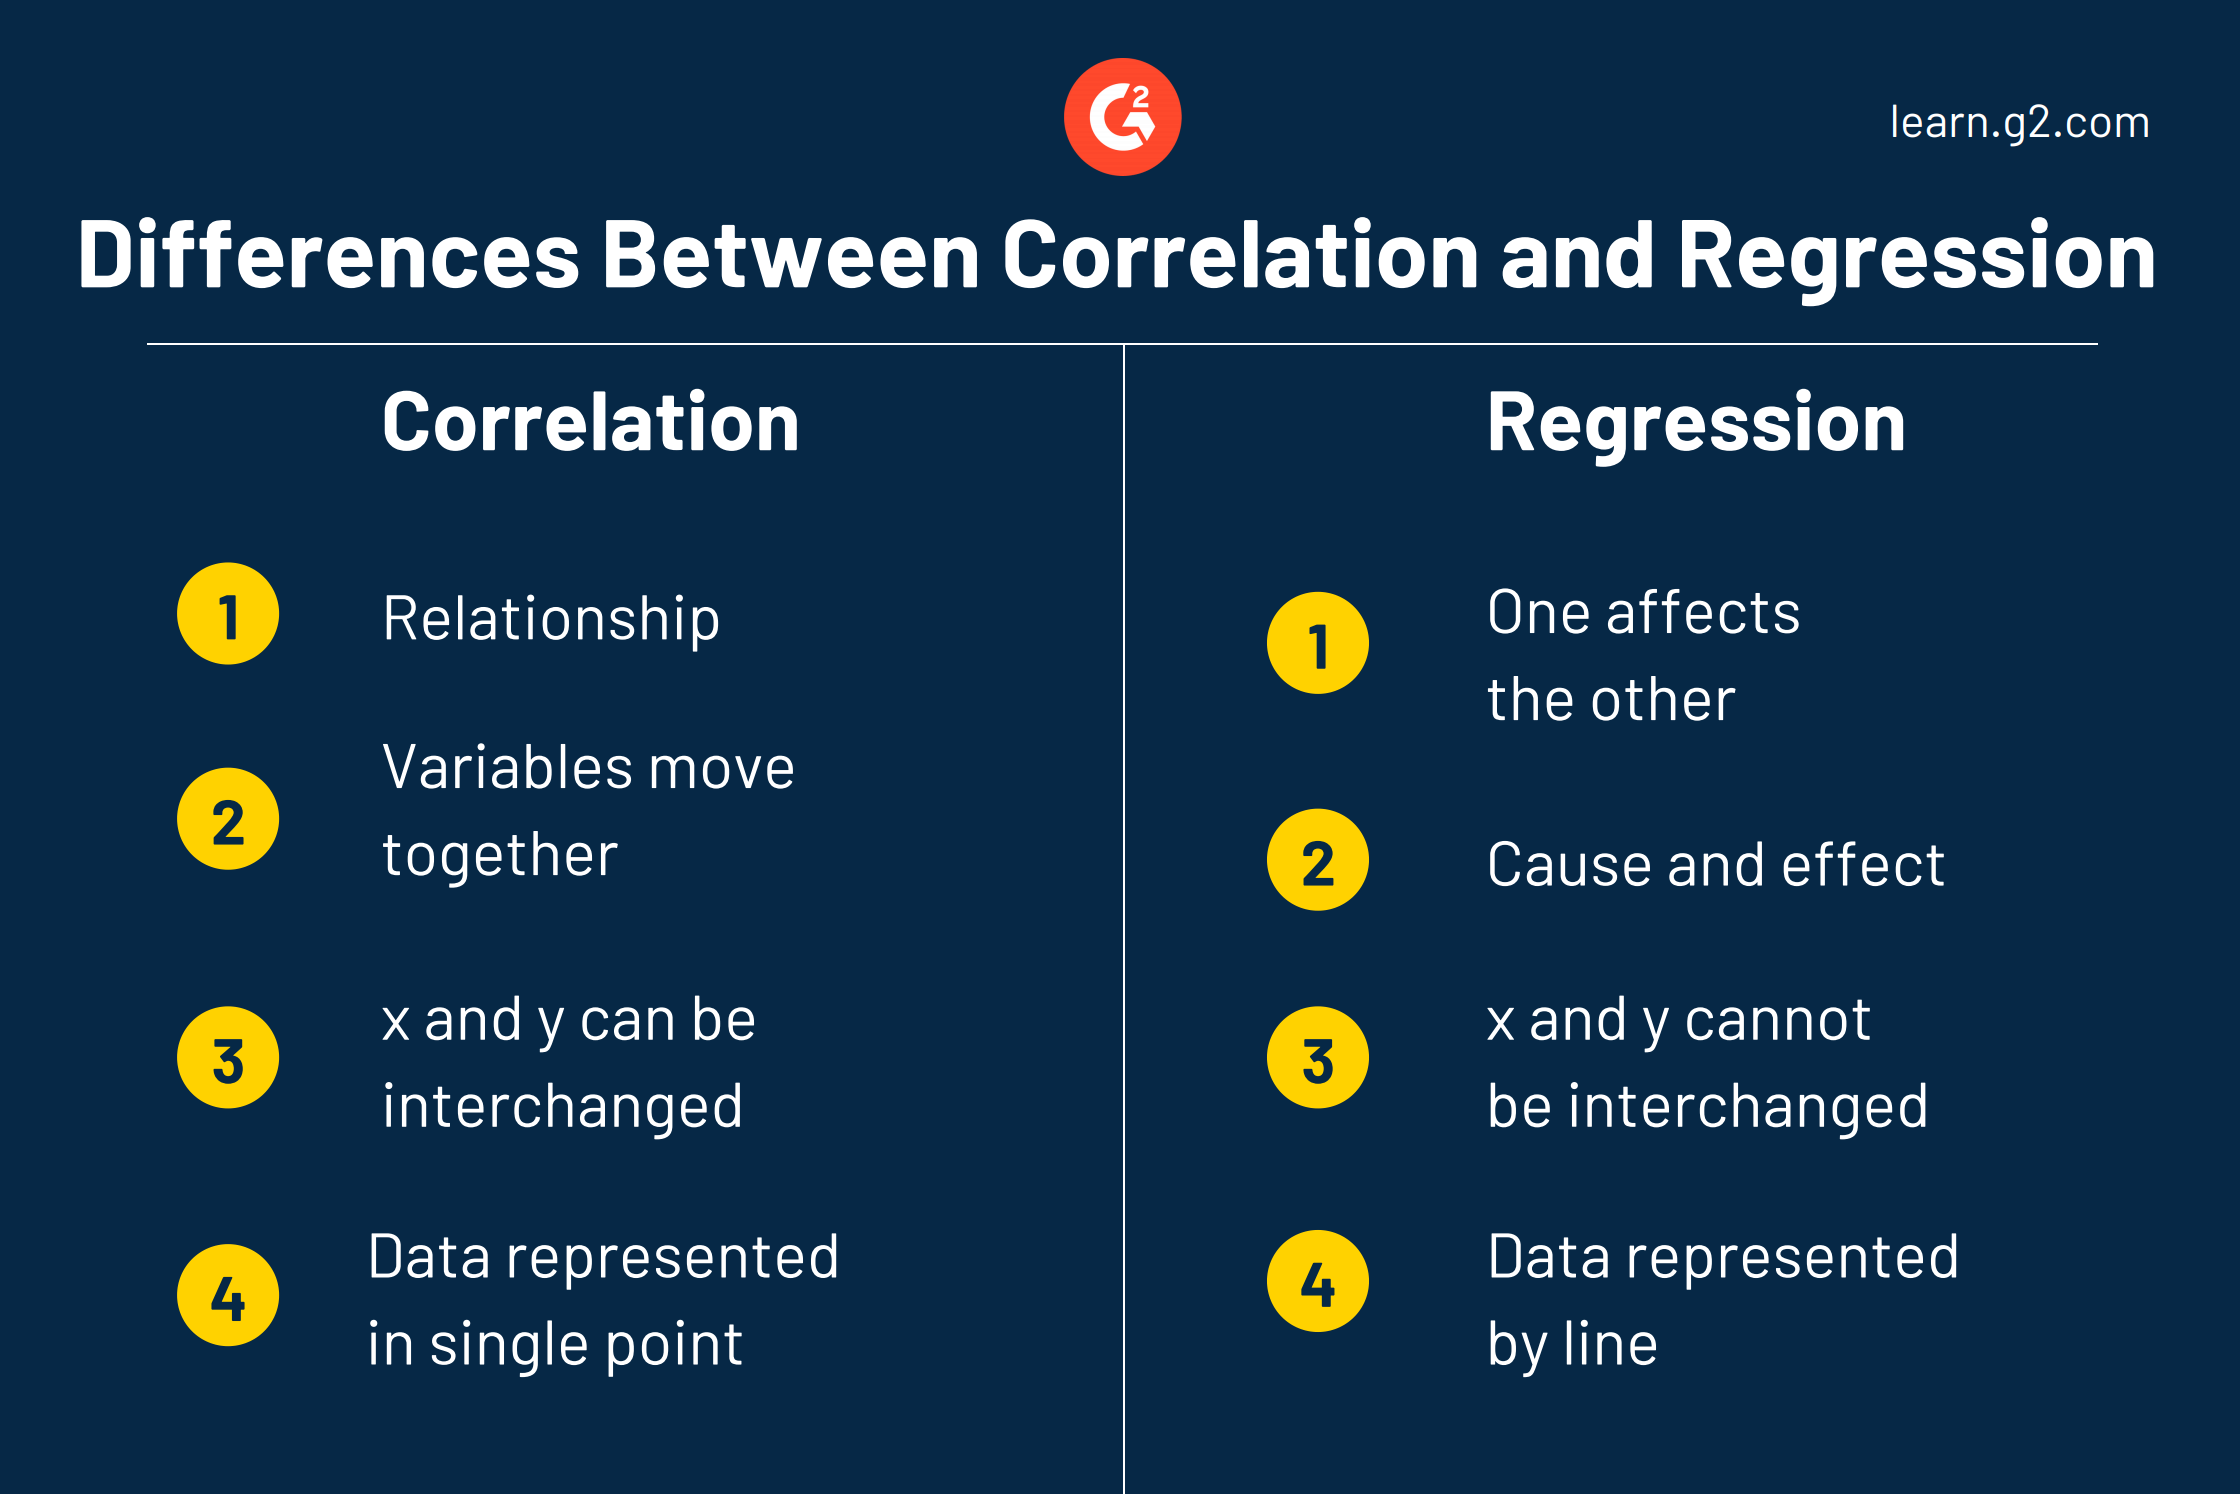
- Regression establishes how x causes y to change, and the results will change if x and y are swapped. With correlation, x and y are variables that can be interchanged and get the same result.
- Correlation is a single statistic, or data point, whereas regression is the entire equation with all of the data points that are represented with a line.
- Correlation shows the relationship between the two variables, while regression allows us to see how one affects the other.
- The data shown with regression establishes a cause and effect, when one changes, so does the other, and not always in the same direction. With correlation, the variables move together.
Similarities between correlation and regression
In addition to differences, there are some key similarities between correlation and regression that can help you to better understand your data.
- Both work to quantify the direction and strength of the relationship between two numeric variables.
- Any time the correlation is negative, the regression slope (line within the graph) will also be negative.
- Any time the correlation is positive, the regression slope (line within the graph) will be positive.